New Beta Strategy ‘Fab Tech Rotation’ is Up Over 100% This Year!
(Scroll down to video at bottom of the page).
The team at SIG just released a new Systematic BETA Strategy for the Nasdaq 100 Universe of stocks called the "Fab Tech Rotation Strategy".

If you like big gains with less active trading and slightly longer hold times, then you might want to bookmark and add the Fab Tech Rotation Strategy to your Trading Plan.
The Fab Tech Rotation Strategy was based on some of Meb Faber's work (of Cambria Investments) on Rotational Strategies and Dual Momentum. The Strategy has a lot of "technology" and moving parts built into it, but is actually super simple to understand and implement. In fact, it can easily be implemented and managed manually, as well as, as an automated Strategy (more to come on that in the near future).
How It Works...
- Fab Tech Rotation holds a portfolio of the strongest 6 stocks in the Nasdaq 100 and rotates approximately 3 trading days before the end of each month into the next 6 strongest stocks. In essence, the strategy will hold a concentrated portfolio of 6 stocks and will turn over the entire portfolio each month.
- (The Strategy uses various regime filters and criteria that may cause it to move positions to cash on any day of the month, move the entire portfolio to cash and/or exit existing positions at the end of a particular month and not enter into any new positions if market conditions do not meet the "Bull Market" filter criteria).
- If on the rotation day any of the same stocks are still in the top 6 ranking, they will remain on the list and the model indicates that they should be held until an exit is indicated.
- Position sizing - each stock position is 16.67% (equal weighted) of the total amount allocated to the Strategy.
- Those following the Strategy should check in daily just to see if the model portfolio/Strategy is suggesting any exits based on it's exit rules.
Strategy Signals and Backtest...
The Daily signals may be found here. As of the time of this posting, the Strategy is in "Beta" and the signals will remain free to access for free members, until such time that the Strategy comes out of Beta and moves into the Pro Strategies as a full Systematic Investing Game Plan member-only service.
Strategy Performance...


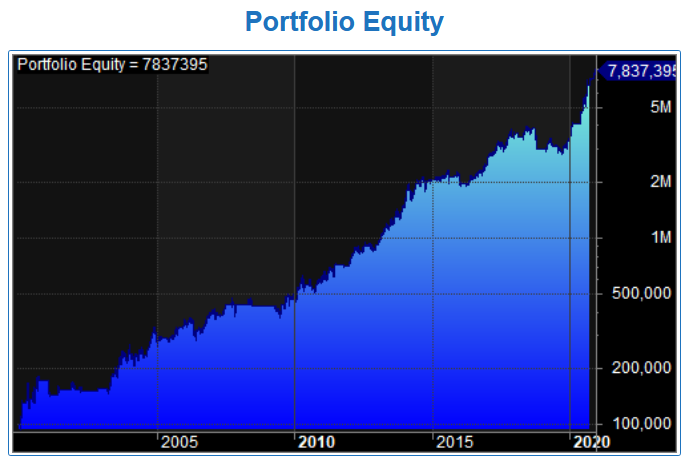
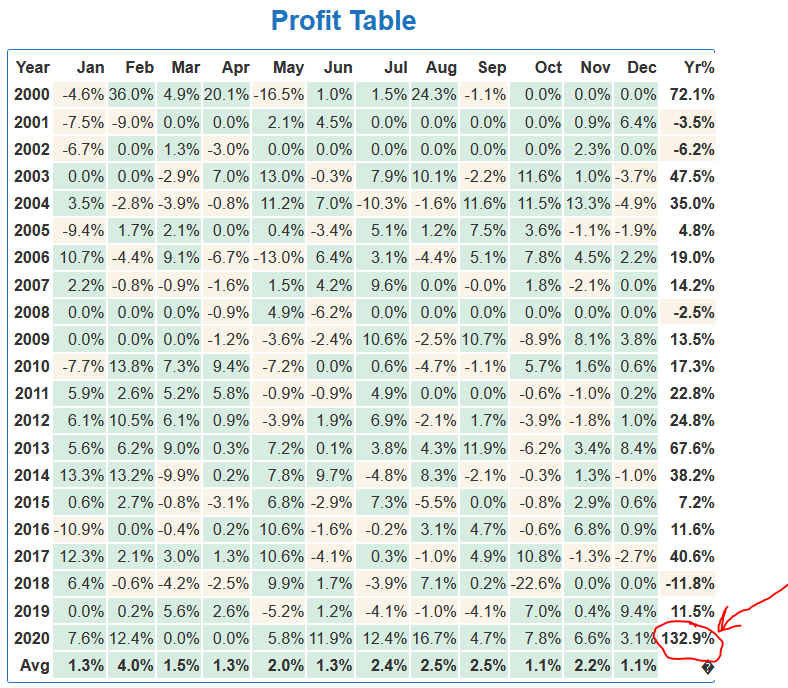
The Strategy Backtest shows that the Fab Tech Rotation has averaged about 23% CAR per year since January 1, 2000 (with a Risk Adjusted Return of almost 37%, since it is in the market about 62% of the time). Amazingly, it's had an incredible year and Fab Tech Rotation is up over 100% this year!
As with any Rotational Strategy with above 20% average annual returns, the Maximum Drawdown that the Strategy encountered over the years is about 30%.
With greater returns come greater draw downs, it's the "law", so it's important to balance out this strategy with other Strategies in your portfolio to smooth out the equity curve. That said, it's interesting to note that most draw downs during the on-going bull market that started after the Global Financial Crisis bottom in 2009 averaged 20% or less. All draw downs, of course, recovered only to see the Strategy hit NEW EQUITY HIGHS.
That puts the CAR/MDD of the Strategy around 0.77 (as of this post) over the past 20 years. However, if you look at the CAR/MDD during Bullmarket periods such as from 2009 to present (Dec 22, 2020), the CAR/MDD is even more impressive and shoots up well over 1!
We believe the Fab Tech Rotation Strategy is well positioned to benefit from the on-going Technology sector play (as technology continues to drive our modern world) and we believe that it will continue to outperform the market going forward.
How to Implement...
Our normal implementation method of choice for trading stocks is using Alera Portfolio Manager (APM), so that we can easily manage the daily entries and exits, whether on a semi or fully automated basis. More information will be provided on this option soon. (If you want to know how we generally automate strategies, check out Video #2 here).
HOWEVER, since this Strategy only rotates once a month (3 trading days before the end of each month), it can be easily managed manually - BUT - those following the Strategy, as mentioned, should check in quickly each day before the market opens to see if the model has changed the BUY status of any stock to #EXIT.
How to Interpret the Daily Scan Results...
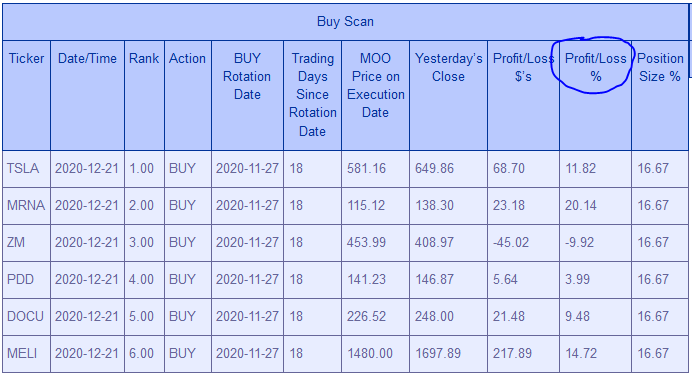
Here's what the Daily Scan table looks like (this link will no longer work once it moves out out Beta):

- Ticker - the stock's ticker/trading symbol.
- Date/Time - the last date/time, typically the previous trading day.
- Rank - this is the relative rank that the ticker/stock was ranked on the last Rotation Date.
- Action - "BUY" means it's still valid to hold in the portfolio, "#EXIT" means the model is suggesting an exit to the position. However, the ticker/stock still appears in the list so that members can see what was suggested for the portfolio that month.
- BUY Rotation Date - is the actual date that the model rotated and first initiated or suggested the current portfolio of tickers/stocks.
- Trading Days Since Rotation Date - this is the number of trading days that the positions have been open or held in the portfolio. In other words, the difference in trading days between 2. Date/Time and 5. BUY Rotation Date.
- MOO Price on Execution Date - Market On Open price on the day (#5) that the positions were opened or executed. This Strategy uses Market On Open orders to execute the trades.
- Yesterday's Close - the close of the previous trading day (#2).
- Profit/Loss $'s - the difference between #8 (Yesterday's Close) and #7 (MOO Price on Execution Date), which indicates the number of dollars per share that the position is in profit (or loss).
- Profit/Loss % - the percent gain or loss since the position entry.
- Position Size % - the suggested position sizing based on the total allocation the member chooses. For example, a $6,000 total allocation would be $6,000/6 = $1,000 per position or approx. 16.67% per position.
As mentioned, the Strategy Signals (Strategy Scans) will be available in the Free Strategy section while it remains in BETA testing, after which it will be moved over to our Pro Strategy Member's Only area.
(Speaking of which, try out our full service and strategies with a no-risk 2-week trial of the Systematic Investing Game Plan membership today for only $14.99 using Coupon Code: secret15)
Let's jump into the video explanation...
Fab Tech Rotation is a less active, short to medium term Rotation Strategy that exploits both the turn of the month phenomenon (i.e. best time to buy stocks tends to be near the end of the current month/beginning of the following month) and also the well known Momentum characteristic of the market (a stock in motion tends to stay in motion, and the trend is your friend until the final bend at the end!).
The individual stocks in the Nasdaq 100 Universe are ranked by absolute strength over varying time periods. The Strategy chooses the strongest six (6) stocks on the Rotation Day (which is 3 trading days before the end of the month). It buys all stocks in the list and sells all positions not currently in the list. If a stock from the previous month is also on the list on Rotation Day, then the position is kept. Each position is equal weighted 16.67% in the total portfolio allocation allotted. (Example - $60,000 / 6 positions = $10,000 per position).
The Strategy also uses various market regime filters and "kill switches" to decide whether each position should be in the market, or not. The Strategy will rotate into cash on a position by position basis should the conditions warrant on any given day (position status will change from "BUY" to "#Exit"). Those managing this Strategy should check positions that need to be exited every day or every several days at most in case there is a change in position status. Therefore, both individual stock positions may rotate fully into cash and stay in cash from time to time AND the entire portfolio may do the same (go to cash), as would be the case in the event of a "Bear Market", as defined by the Strategy Rules.
Enjoy,
Dave
Systematic Investors Group Team
